Debugging information is needed to solve complex setup or troubleshooting issues. This information is primarily intended for developers and technical support engineers.
On the 'Diagnostics' page of the web interface, you can check the network connections, view and save the router system log, configure network traffic capture, enable the debug mode, and view a list of active connections with the ports used.
Self-test file. Refer to the Saving the self-test file instructions for more information.
To save the
self-testfile from the 'Diagnostics' page in the 'Self-diagnostics' section, click on 'Download the self-test file'.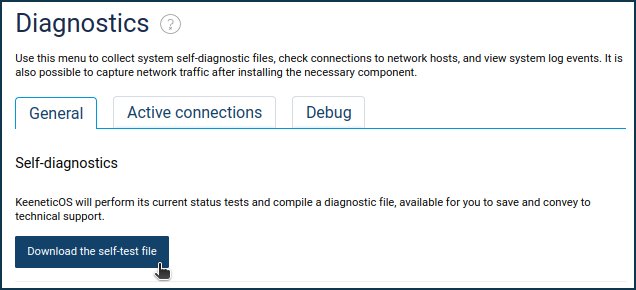
The web browser will download the file. If the Save File window appears, specify the location (the folder in which the file will be saved) and press 'Save' or 'OK'.
You can open the
self-test.txtsystem file for viewing in any text editor.System log. Please refer to the System log manual for more information.
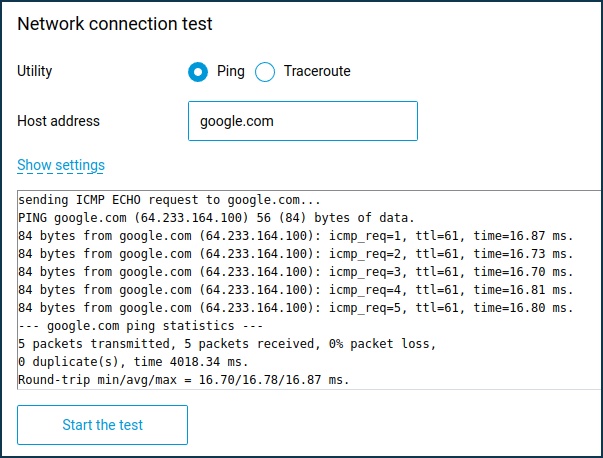
Network connection test.
In the 'Network connection test' section, you can test the connection to the Internet directly from your Keenetic using the ping and traceroute network utilities. In the 'Host address' field, specify the host's IP address or domain name you want to test and click the 'Start the test' button. Click 'Show settings' to configure more settings.
Packet capture.
In the 'Packet Capture' section, you can enable capturing network traffic passing through the selected interface of your Keenetic. You may find more information in the article Network packets capture.
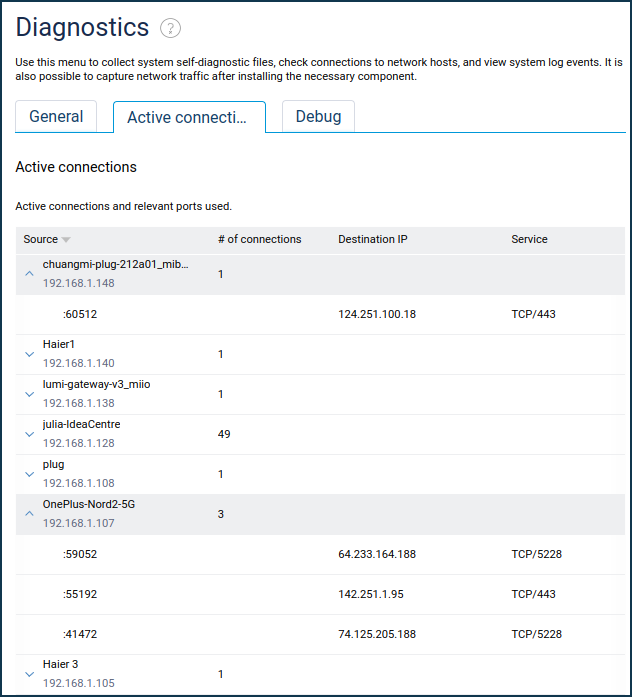
Active connections. A separate 'Active connections' tab displays a list of active connections with the ports used. For example:
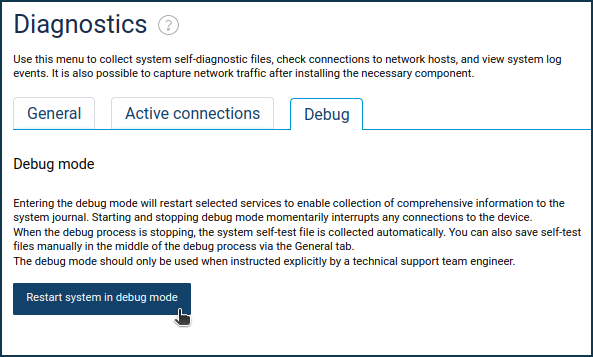
Debug mode.
In the 'Debug' section, you can enable advanced diagnostics, including detailed logging to the system event log for Internet connections (IPoE, PPPoE, L2TP, PPTP, UsbModem, IPv6) and DHCP server/client.
Importante
Please do not enable debug modewithout a request from a technical support engineer. If you want to give the primary diagnostics to the technical support, save it according to the instructions Saving the self-test system file and send it to the support service.Follow the steps below if the service engineer has asked you to enable debug mode. Click the 'Restart system in debug mode' button.
Importante
After enabling or disabling debugging, the current connections will be forcibly re-established.
Thus, if enabling the debug mode is to see the reasons for the interruption of the connection to the ISP, you should wait for the issue to happen after the initially planned reconnection.
After the debug mode is enabled, the message about the date and time of debugging start will appear.
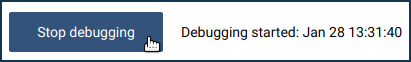
Press the 'Stop debugging' button when the problem occurs or repeats itself.
After that, the
self-test.txtfile with all necessary debugging information will be automatically downloaded to the computer. Theself-test.txtdiagnostic file contains diagnostic information and data from the log file and configuration file. The resulting self-test file can be sent to our technical support team for troubleshooting purposes.Importante
The settings in the
self-test.txtfile do not contain passwords, which ensures security when sending it to the support team.