Host traffic monitor
Important
The Host traffic monitor feature only works for IPv4 traffic. The support for IPv6 traffic will be included in KeeneticOS version 4.0.
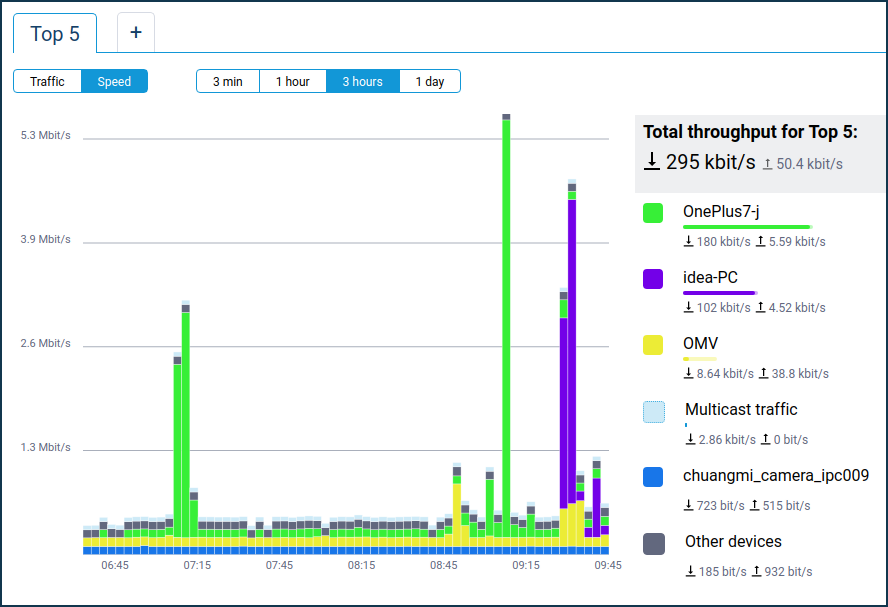
The Host traffic monitor feature allows you to monitor the traffic consumption of registered devices (local traffic is not counted) for the last 24 hours. The graph shows the Top 5 traffic consumers in the selected time interval (3 min / 1 hour / 3 hours / 1 day). Clear statistics can be useful for simple monitoring of device activity and traffic amounts, as well as bandwidth allocation or specific restrictions.
The graph is available in the web interface on the Host traffic monitor page.
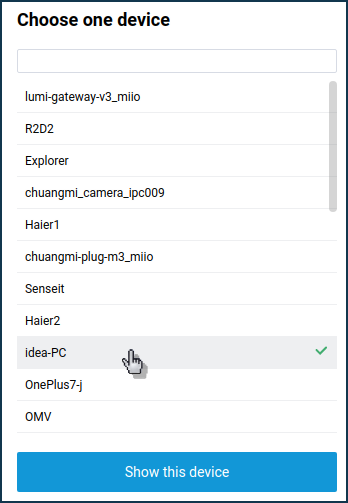
To display traffic statistics on the graph, you have to register the device in your home network in advance.
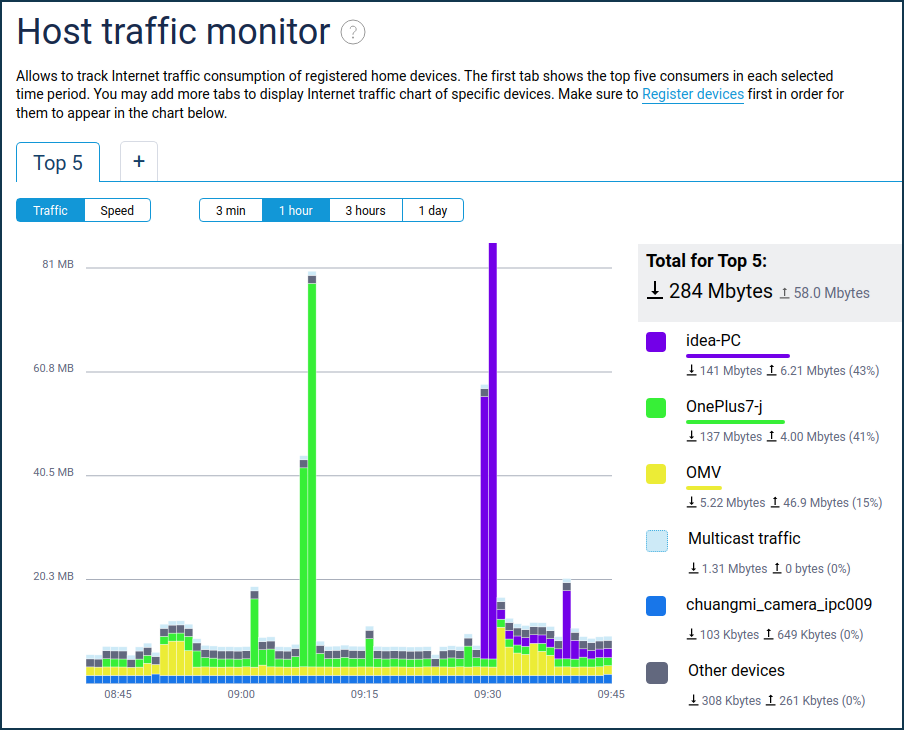
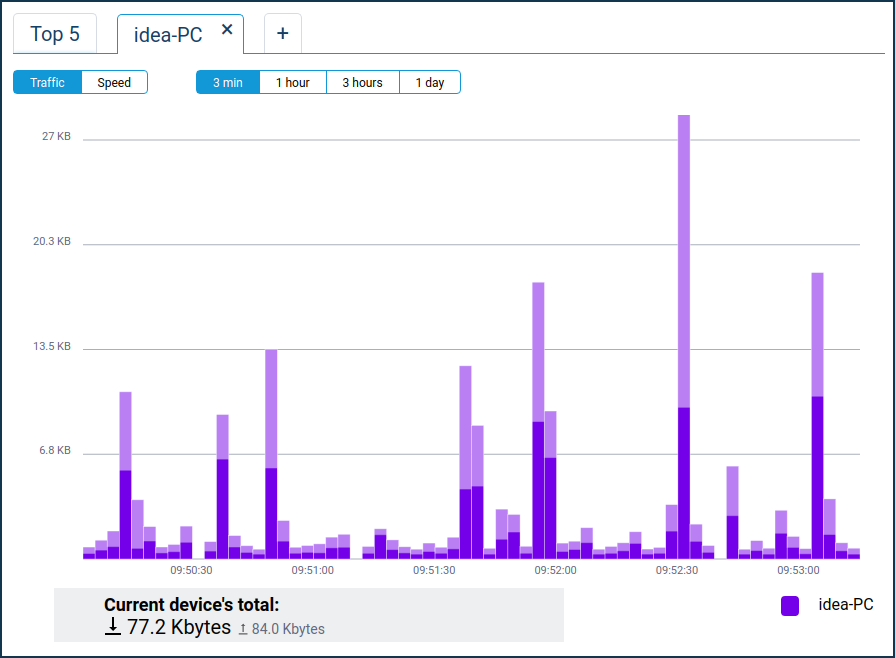
Additional tabs can be added to display the traffic of a specified device.

Since KeeneticOS 3.4.1, the Host traffic monitor counts multicast and unregistered device traffic, and since KeeneticOS 3.6.1, a new Other devices category has been added.
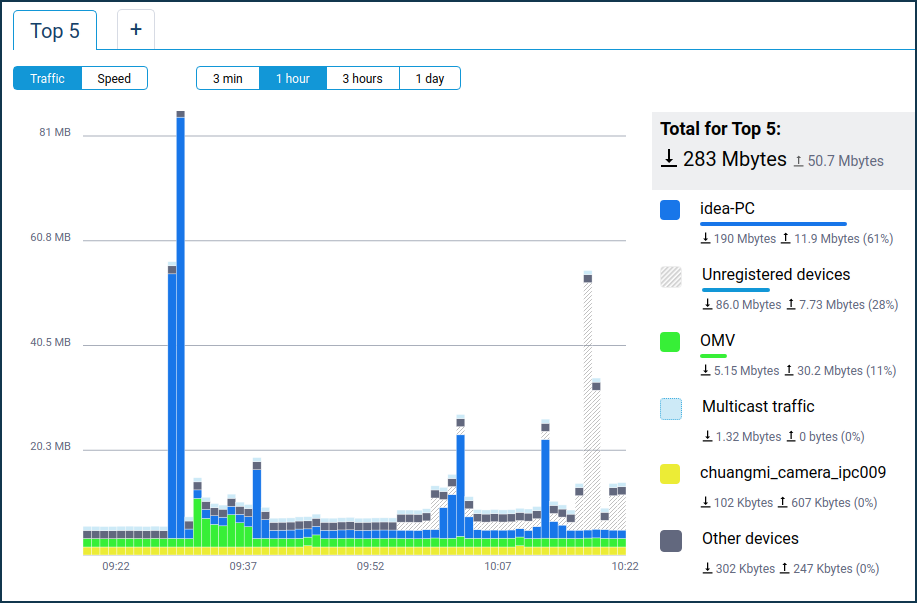
Multicast is group communication when the recipient of network packets is a group of devices (traffic destined to subnet
224.0.0.0/4). The most typical example is IPTV traffic. Also, many modern services use multicast (e.g. DLNA with SSDP, UPnP, IGMP etc.).Unregistered devices traffic is the total traffic of all unregistered devices.
Other Devices — includes the sum of the traffic of other registered devices, excluding the
5that consume the most traffic (Top 5).